Please welcome final results for GW 20 with autosubs, vice-captains and bonus points. Expected overall average is 39 (FPL round actual average down). I’ve added GW Hall of Fame and GW Hall of Shame with links to some interesting scores in my samples.
SUMMARY
|
Random Sample |
Top 10K |
| Number of Managers |
20,000 |
10,000 |
| GW20 Average Score |
39.7 |
48.2 |
| Average Points Deducted for Point Hits |
0.7 |
0.8 |
| Players Played per Team (out of 12) |
11.0 |
11.9 |
| Captains Played |
91.5% |
100.0% |
| of Which: Vice-Captains |
17.5% |
0.3% |
AVERAGE POINTS DISTRIBUTION
AVERAGE POINTS PER TEAM BY SOURCE OF POINTS
|
Random Sample |
Top 10K |
| Source of Points |
Points |
% of the Average |
Points |
% of the Average |
| Minutes Played |
20.7 |
52.1% |
23.2 |
48.1% |
| Goals Scored |
10.0 |
25.1% |
14.4 |
29.8% |
| Assists |
2.7 |
6.9% |
3.1 |
6.4% |
| Clean Sheet Points |
6.8 |
17.1% |
7.8 |
16.1% |
| Goals Conceded |
-1.3 |
-3.2% |
-0.9 |
-1.7% |
| Own Goals and Penalty Misses |
0.0 |
0.0% |
0.0 |
0.0% |
| Red and Yellow Cards |
-3.2 |
-8.1% |
-4.3 |
-8.7% |
| Saves and Penalty Saves |
0.4 |
0.9% |
0.4 |
0.9% |
| Bonus Points |
3.7 |
9.3% |
4.5 |
9.3% |
| TOTAL |
39.7 |
100.0% |
48.2 |
100.0% |
10 PLAYERS CONTRIBUTING THE MOST TO THE AVERAGE
| Random Sample |
|
Top 10K |
| Player |
GW Points |
Per Average Team |
% of the Average |
|
Player |
GW Points |
Per Average Team |
% of the Average |
| Suárez |
6 |
5.6 |
14.2% |
|
Suárez |
6 |
11.6 |
24.1% |
| Yaya Touré |
7 |
3.5 |
8.7% |
|
Yaya Touré |
7 |
5.0 |
10.4% |
| Mignolet |
7 |
2.6 |
6.4% |
|
Walcott |
11 |
4.9 |
10.1% |
| Hazard |
6 |
2.0 |
5.0% |
|
Hazard |
6 |
4.2 |
8.8% |
| Baines |
11 |
1.5 |
3.8% |
|
Mertesacker |
5 |
2.6 |
5.5% |
| Walcott |
11 |
1.5 |
3.8% |
|
Mignolet |
7 |
2.5 |
5.2% |
| Mertesacker |
5 |
1.4 |
3.5% |
|
Coleman |
2 |
1.7 |
3.6% |
| Oscar |
14 |
1.4 |
3.5% |
|
Terry |
6 |
1.3 |
2.7% |
| Terry |
6 |
1.0 |
2.6% |
|
Lukaku |
2 |
1.1 |
2.2% |
| Coleman |
2 |
0.9 |
2.2% |
|
Szczesny |
6 |
0.8 |
1.6% |
AVERAGE POINTS PER TEAM BY LINE IN FORMATION
|
Random Sample |
Top 10K |
| Line in Formation |
Points |
% of the Average |
Points |
% of the Average |
| Goalkeeper |
5.1 |
12.9% |
5.0 |
10.4% |
| Defenders |
10.3 |
26.0% |
9.3 |
19.2% |
| Midfielders |
14.2 |
35.9% |
18.9 |
39.3% |
| Forwards |
10.0 |
25.2% |
15.0 |
31.1% |
|
|
|
|
|
| Points for Captain |
8.9 |
22.4% |
11.7 |
24.3% |
| Points on the Bench |
2.8 |
7.0% |
4.3 |
8.8% |
| Points off the Bench |
3.6 |
9.1% |
1.0 |
2.0% |
| TOTAL |
39.7 |
100.0% |
48.2 |
100.0% |
AVERAGE POINTS BY POSITION
|
Random Sample |
Top 10K |
| Position |
Points |
Points |
| Goalkeeper |
5.0 |
5.1 |
| Defender |
2.9 |
2.8 |
| Midfielder |
3.9 |
5.0 |
| Forward |
3.2 |
3.2 |
| (*) This table only accounts for players who have played positive minutes this week |
GW 20 HALL OF FAME
GW 20 HALL OF SHAME
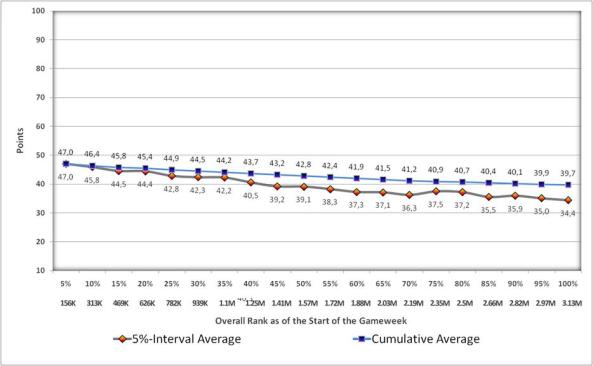
In this post, I take a look at 2 samples: randomly selected 20,000 FPL teams and the top 10,000 FPL teams as of the start of the gameweek. Because of the law of large numbers, we can make inferences about the overall FPL league based on the statistics for the random sample.
I’ve also added interval estimates for most statistics for the whole FPL game. If you’re familiar with the concept of confidence intervals, you can point at a specific number characterising the random sample to see 99% confidence intervals for the respective number characterising all the 3 million FPL managers.