|
team selection
|
scoring
Top 10K turnover
|
Top 10K Teams Turnover
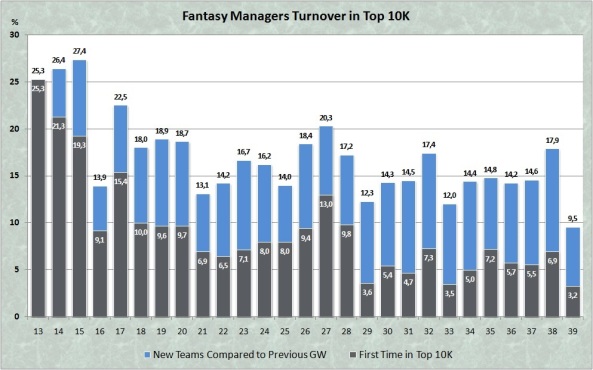
The top 10K sample of each gameweek was unique and different from the top 10K sample of any other week, because some teams were dropping out of top 10K and others were replacing them. How many teams usually changed from week to week? The diagram below answers this question. GW 39 stands for the final top 10K after GW38.
- An average gameweek saw 1,693 teams, or 16.9%, drop out and be replaced by teams from outside top 10K. This number changed from week to week, with GW15 bringing the biggest changes (2,737 teams), and the final gameweek the smallest (only 953 teams changed). The gaps between teams were increasing as the season progressed and the turnover was decreasing as a result.
- Some teams were drifting around the verge of top 10K, going in and out. The grey bars show the share of teams which were completely new to top 10K during the observed part of the season. There were 911 such teams in a typical gameweek.
- In total, there were 32.077 different teams in top 10K during the period from GW12 to the end of the season.
|
team selection
|
scoring
Top 10K turnover
|

